What is BNS3?
The Basic Needs Student Success Survey (BNS3) is a survey focused on assessing food insecurity, health, and assistance program effectiveness for undergraduate students who are currently enrolled in the Educational Opportunity Program (EOP). This specific pilot that I worked on is the second study conducted by the Center for Healthy Communities at Chico State, and was administered to students at three CSU campuses: Chico, Fresno, and Northridge. The main purpose for this second cross-sectional study was to revise the BNS3 tool and validate student perception on impact of assistance programs before the statewide dissemination (which we are currently working on now).
The homepage of the website does a much better job at explaining the background, run time, and purpose of the survey than I do, so please feel free to click here to view the page.
Data Processing
I never really understood how much data processing you truly do with real world data until I began working on this project. If you’ve done any kind of data science or machine learning project than you’ve mostly likely had experience working with data from Kaggle or similar websites, and there is some data processing involved in order to get it into a usable format. Fill missing values with the column mean, change some data types around, a little feature engineering magic here and there. But nothing too serious right? We’re talking maybe a couple hours and 100 lines of code before you’re ready to go. And that’s what I figured when I heard that I’d be processing the survey data for BNS3 (spoiler: it wasn’t that easy). I wasn’t sure what I was expecting, maybe like a short questionnaire of Yes/No and numerical responses that I could clean up in a couple hours? But then I opened the data file… Hundreds of questions (all of which needed to be reformatted) and what would turn out to be my biggest enemy, free response questions.
So I started cleaning, and 30 hours later, I thought I had finally finished. But then I met with my supervisor, found more things to reformat, and another 30 hours of cleaning began. Repeat this processes over the first month of my research program and I finally finished the cleaning script (kind of at least). An entire month just for cleaning data… And it wasn’t even finished. Six months later I still go back and add updates here and there when I find an error or we change our minds on a previous decision. But it was a learning experience like no other, real world data isn’t as pretty as “machine learning ready” data sets you find online, and spending weeks figuring out how to process data was one of the main learning experiences from my research program.
The Free Response Questions…
Something I realized a couple hours into the cleaning script was given the opportunity, students like to provide their own more detailed answers. Which is great, more data for us to use and find discoveries from. But that also means more cleaning so that we can turn the answers into usable data. Many questions allowed students to select “other” and provide their own text responses, which meant we then needed to parse these responses into the original question answers. Just one example of this was a question about students majors, which gave the college’s which their major fell under, but a lot of students didn’t know this and provided their exact major (which I don’t blame them, a lot of these I thought belonged in different college’s then they actually do).
BNSp2 <- BNSp2 %>%
  mutate(q16=case_when(grepl('Art|Arts|Humanities|Music|Philosophy|English|History|Asian',
                             q16_6_text, ignore.case = TRUE) ~ 'Arts and Humanities',
                       grepl('Child|Gender Stu|Psychology|Criminal|Social Work|Sociology|Geography|Political|Health|Kinesiology|Exercise Phys|Liberal Studies',
                             q16_6_text, ignore.case = TRUE) ~ 'Public Health, Social Services, Social Science, Education',
                       grepl('Business', q16_6_text, ignore.case = TRUE) ~ 'Business, Recreation, Culinary Services',
                       grepl('Agricultur', # left off "e" so Agriculture & Agricultural would be selected
                             q16_6_text, ignore.case = TRUE) ~ 'Science, Technology, Engineering and Math (STEM)',
                       TRUE ~ q16),
         q16_6_text=ifelse((q16 != "Other") | (is.na(q16)), NA, q16_6_text))
So the code isn’t too rough, just some regular expressions and dplyr to take the free response text and convert it back into the original question responses. But I also had to go through each school (Chico, Fresno, and Northridge) to make sure they all had their majors falling under the same college’s, which they did for the most part. And then there was considering spelling errors (which I again can’t complain about since I make more typos than anyone I know), extra characters on the end of the majors, and unique majors that I couldn’t find an exact college they fell under. This whole process was repeated for many, many questions throughout the survey. Which again, was a great learning experience for working with real world data and how it actually gets processed. But also I’d be happy if I don’t see any uncleaned data for a while.
Building the Website
So month one was spent building the cleaning script and getting the data into a usable format, and month two (and the following few months) was spent actually creating the BNS3 website. The website itself was built using Rmarkdown and GitHub, where each page of the website is an Rmarkdown file containing the code to create the plots, tables, and summaries which was then deployed using GitHub Pages. This wasn’t something I had done before, or even knew was a thing when I heard about it, so again I was venturing out into a new learning experience. Luckily some of the template for the website (css file, how to link everything, etc.) was provided for me by a student who worked on the BNS3 Pilot 1 Website, and so began my work on creating the pilot 2 website.
Creating the actual framework of the website took about two weeks; getting all the RMD files set up, reading in the data and creating the initial graphs, and writing the initial text summaries and calculating statistics. Since we were using Rmarkdown I was able to put the actual figure code within the file so they would change if any of the data was altered. But being new to Rmarkdown I didn’t know about inline code snippets, and so I calculated all the summary statistics within the R console which I then copied and pasted in the text. I did this same thing with the figure labels, writing “Figure 1.1” rather than using some type of function (which I now wrote and implemented). And this led to my biggest mistake on the entire BNS3 process…
My Biggest Mistake
The target audience of BNS3 was junior and senior EOP students at each campus, but there were also 13 students in the data that were a different class standing. Through some back and forth we decided that it would be best to drop the students from the data set since they didn’t fall in the target audience. Okay easy enough right? Just filter the data and all the graphs will automatically update. But then I thought about the text summaries… All of the numeric values I had calculated were wrong now. Probably around 100+ summaries that all had incorrect values now that needed to be fixed. So I did it, probably around 20 hours of just copying and pasting inline code to make sure the summaries would update if the data ever changed again. Now we’re good, nothing else to fix right?
Of course there was. We added more graphs, dropped graphs, and changed page orders. Of course they all needed figure labels, but wait I had written in each label by hand below the graphs, they weren’t coded to change as more graphs were added or dropped… More copying and pasting of inline code after I wrote a function to do exactly what was needed. And suddenly it was Friday, an entire week just fixing my mistake of writing in the summaries and labels by hand instead of using inline code… Never again will I hard code any kind of number or label in my work again… Ever…
Revision Process
In my projects I’m use to just throwing a graph together and calling it good, I’m really the only person looking at it so it doesn’t have to be perfect or follow a certain layout. But with the BNS3 website, the graphs are being looked at by both an internal and external audience of all different academic backgrounds so they have to be simple and interpretable. That’s one thing I really took away from working on the website, you don’t need to create complex graphs with multiple layers but rather simple graphs that can convey complex results. On top of this, the first graph you make won’t always be the final one you use.
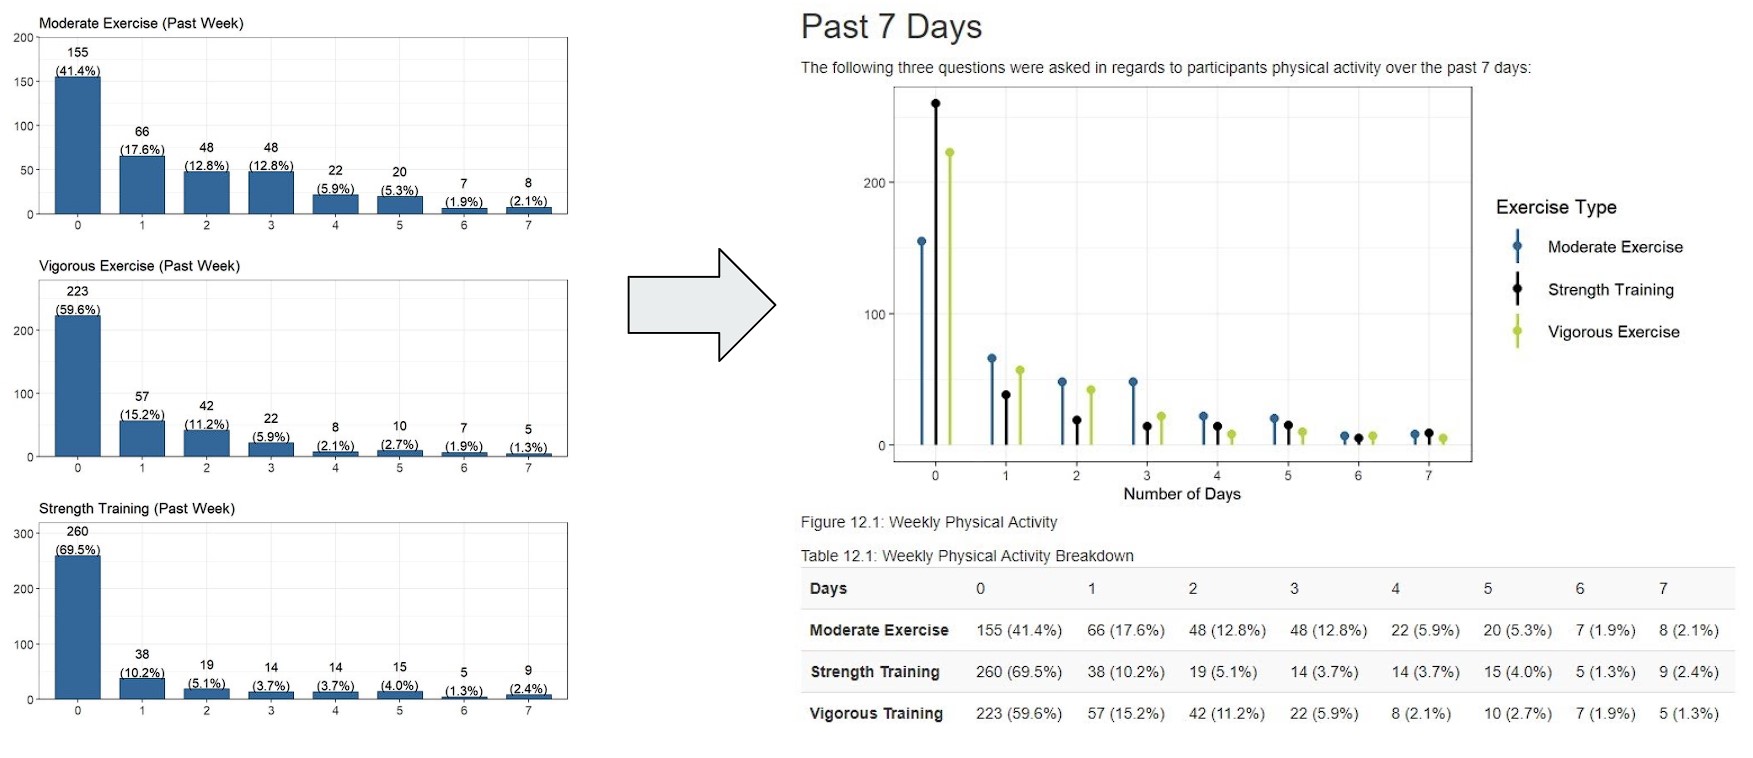
This is just one example of the revision process that went into a lot of the graphs on the website, a breakdown of student’s physical activity over the past week at the time of the survey. It started off as three separate bar charts, but as we met and discussed the layout, we realized that each graph had the same general layout and values so why not just put it into a single graph. This turned into a single side-by-side bar chart, which still wasn’t exactly what we wanted, and eventually led to the lollipop graph being our final version. But we had also lost the numerical breakdown of percentages and counts, and adding the table below that saved this information in a simple format. This revision process of creating the graph, meeting to revise, and eventually finding the perfect combination was repeated throughout the creation of the website and as an eye opening experience compared to my usual “create the plot and call it good” that I’ve done on my personal projects.
Where to now?
As I’m writing this (1/21/22), the BNS3 Pilot 2 website is “officially” completed and is in the process of being published. Of course there is more that I could revise or update or slightly tweak, but we’ve all come to the conclusion that at some point we just have to call it good enough. A lot of hours went into this website and it’s going to be amazing seeing it actually being used by other people and hopefully helping them out as well. So where to from here now?
In terms of BNS3, the statewide rollout of the survey is on the horizon and my main roll in that will be running the scripts I wrote in order to automate the whole process. Writing scripts that will automatically assign students into groups, update information by working with Google Sheets, and sending survey links and payments using Gmail is something completely knew to me. And again, I thought it was going be a simple process but the flowchart below shows just how complex this process will be.
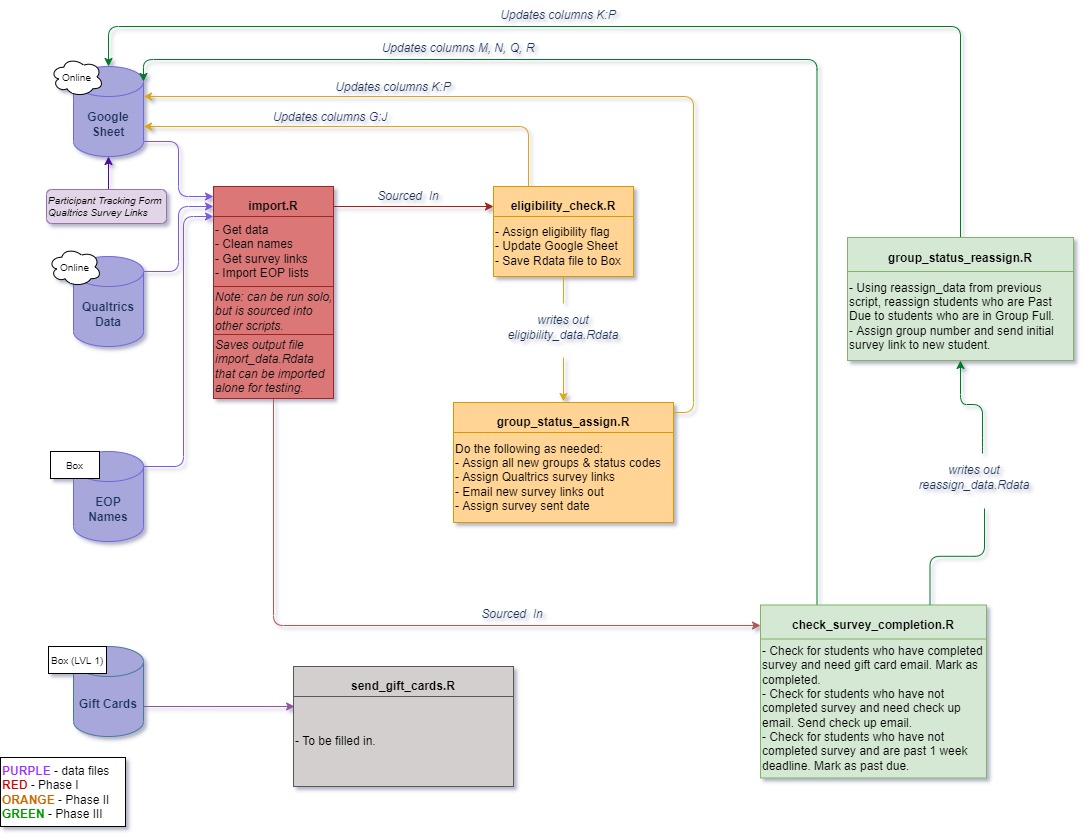
Countless hours have been put into these scripts and I’m excited to see all of them be implemented in the following months. Hopefully I’ll be able to stay with CHC throughout the entirety of the first statewide rollout; from collecting the data, to writing the cleaning script, and possibly even into creating the statewide website. BNS3 has been an amazing learning experience as my first introduction to real world data clearning and website creation, and I’m excited to see where the project continues to grow in the future.